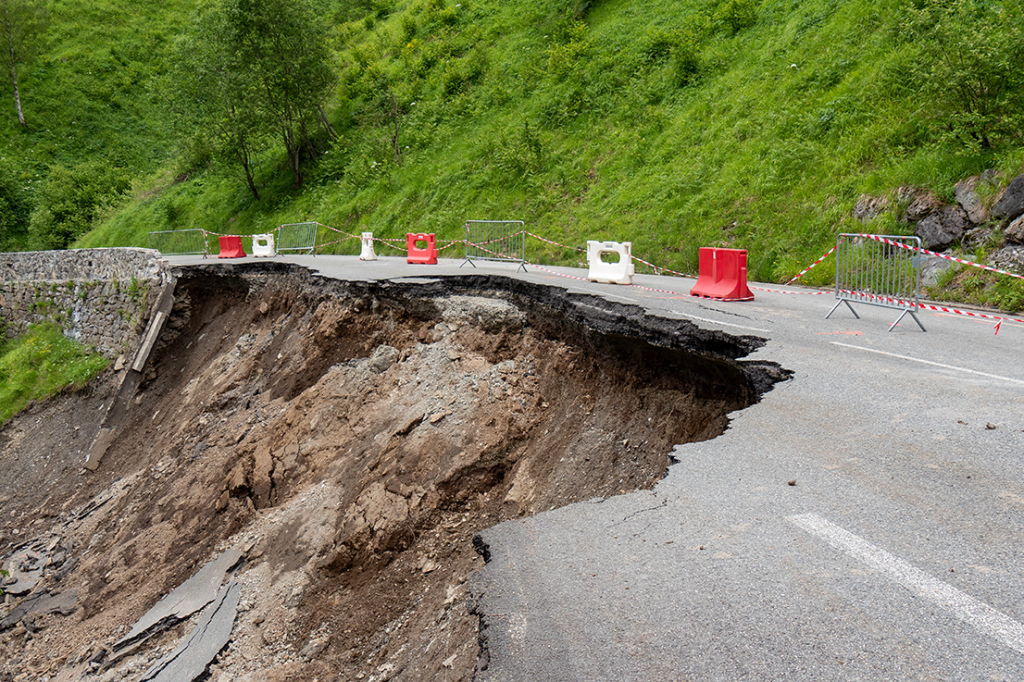
Most former industrial sites have a legacy of buried structural hazards and contamination. Geophysical surveys can detect buried targets without the need to excavate. Many industrial contaminants, such as salinisation by acids and hydrocarbon plumes, can leave a significant geophysical imprint on the subsurface that can be imaged.
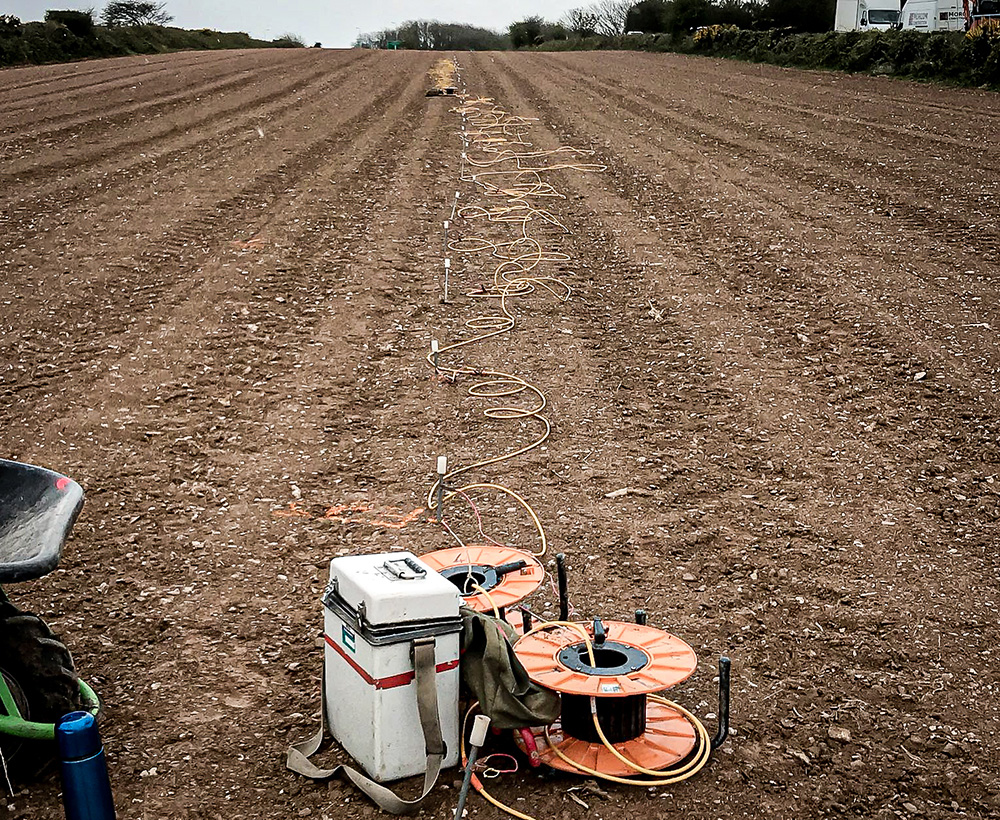
Mapping subsurface structures consists of an initial survey using a combination of metal detection, magnetic, electromagnetic and ground conductivity mapping. These techniques target both direct (i.e. metal supports/pipes, rebar, foundations, etc.) and indirect (i.e. variation in the backfill material, trench fill, etc.) subsurface geophysical properties.
More detail on geophysical targets in terms of depth, size and lateral extent can be achieved by following up using methods such as ground radar (GPR), resistivity tomography and microgravity techniques.
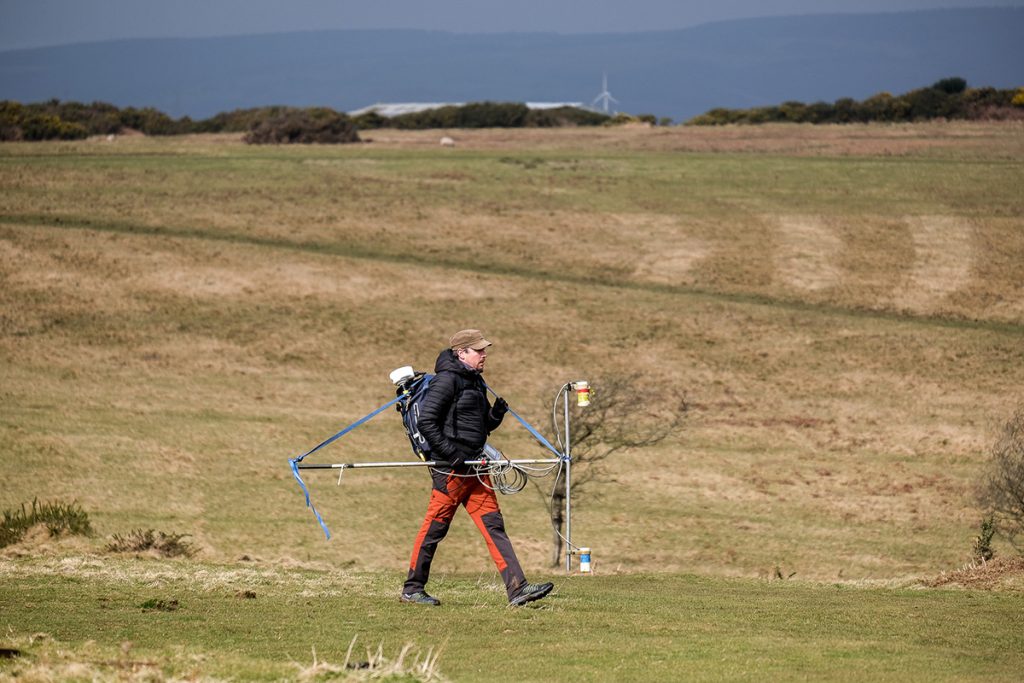
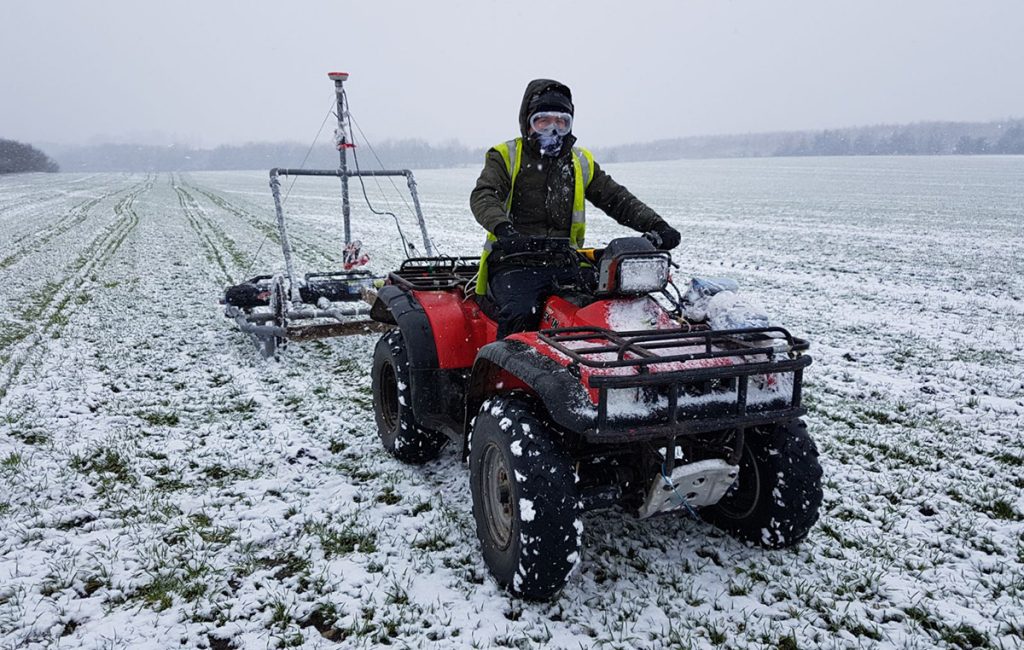
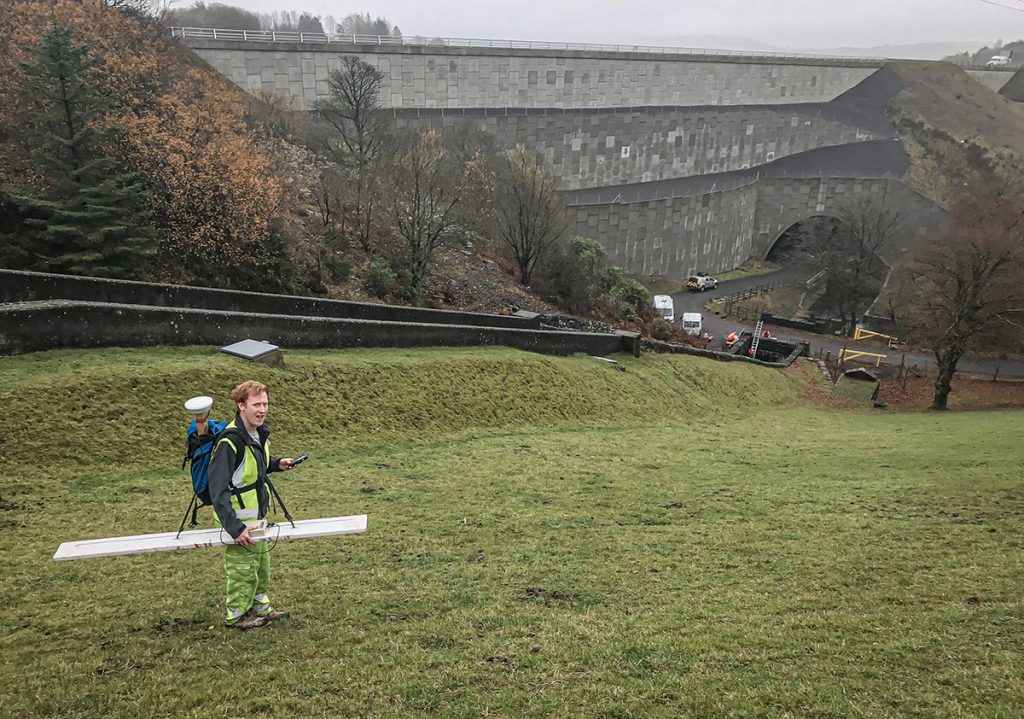
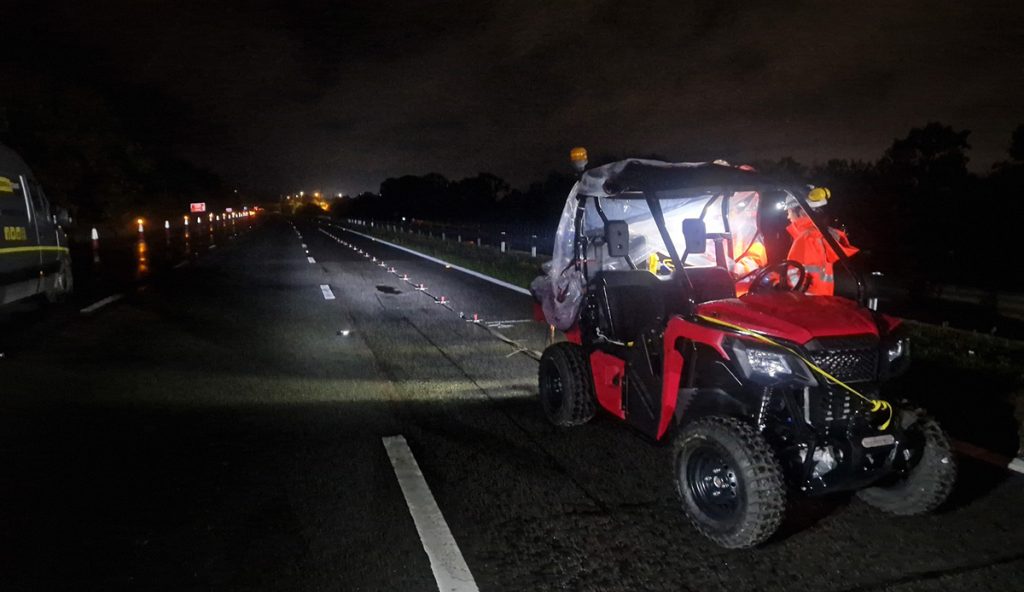
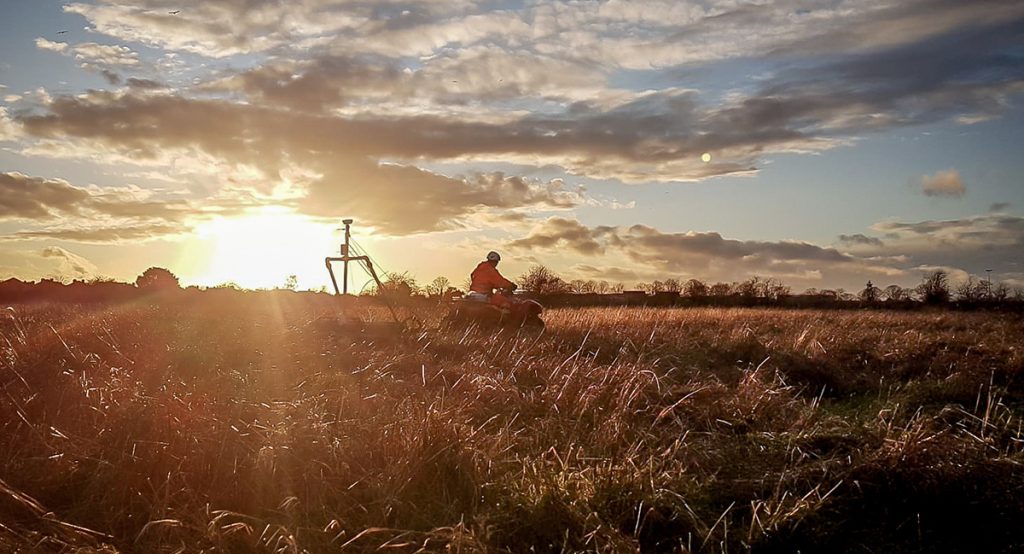
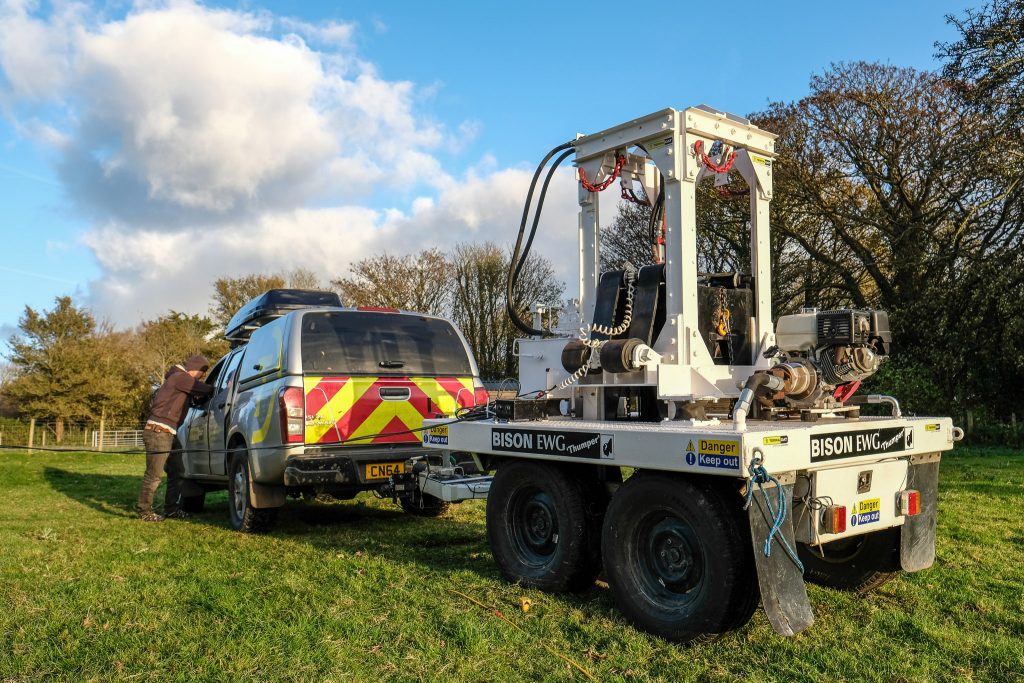
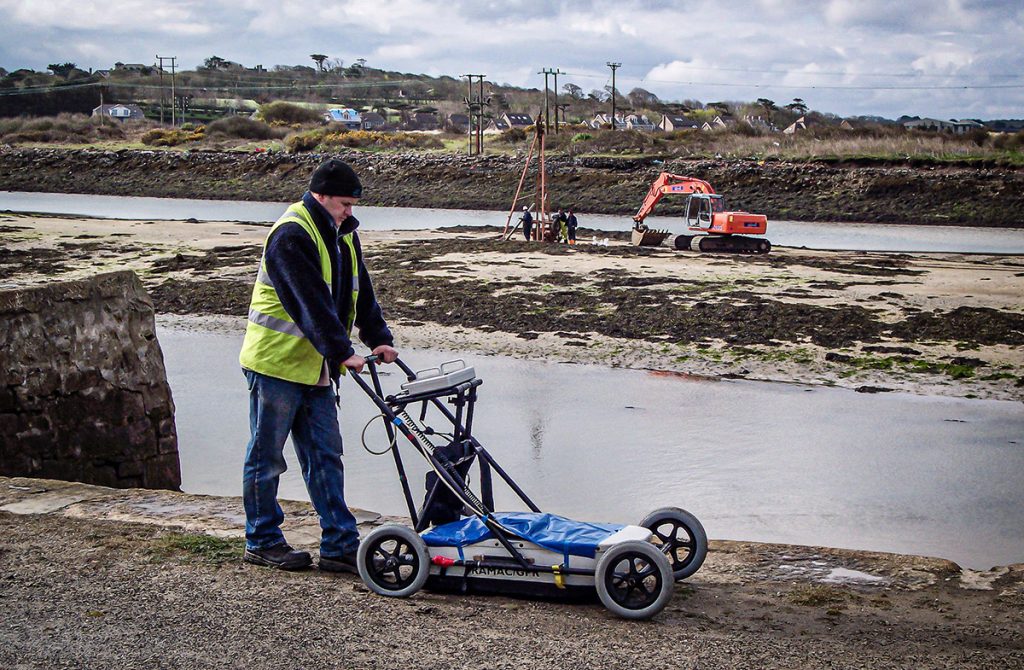
TerraDat is able to acquire data rapidly across large areas by utilising bespoke carts mounted ATVs with real-time positioning provided by RTK GPS systems. This provides us with coverage rates of up to 6ha a day, depending on site conditions.
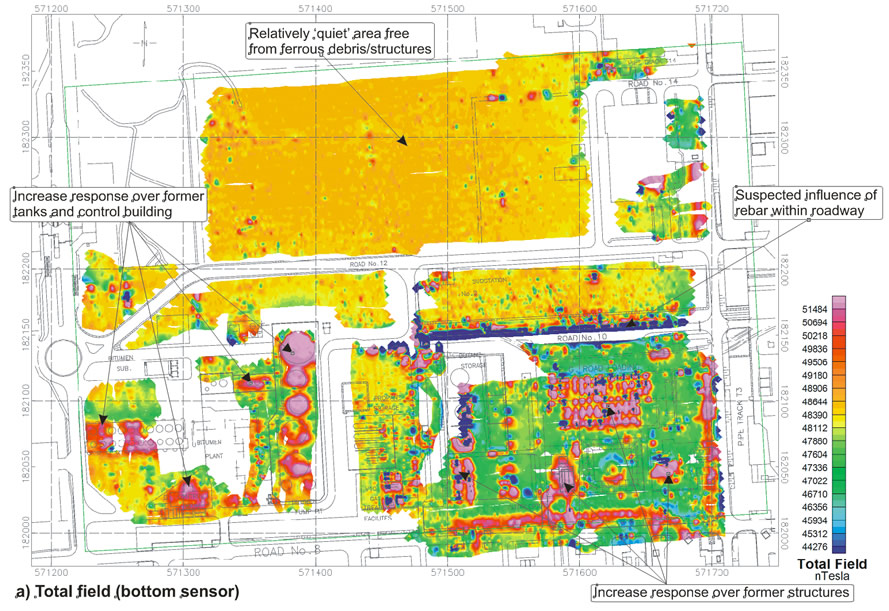
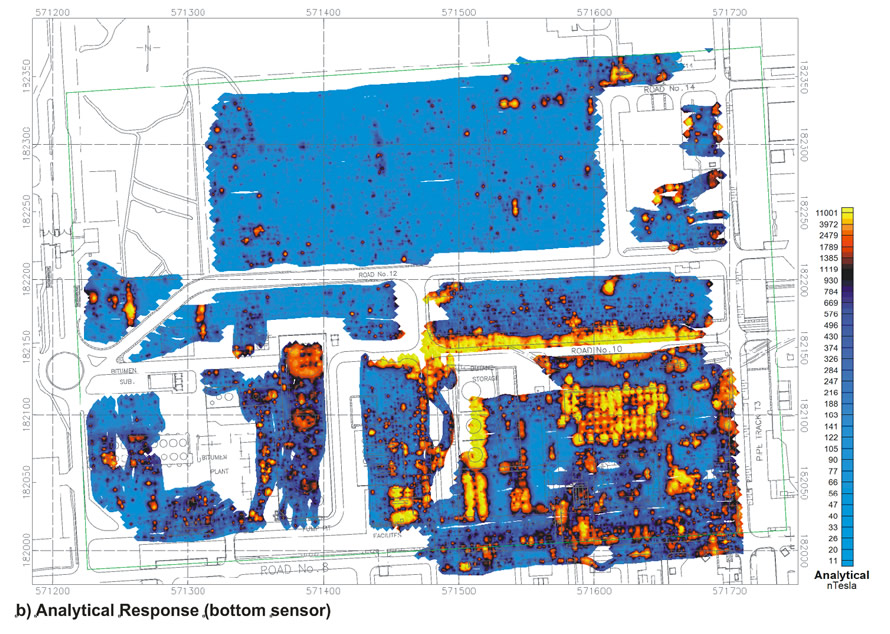
The data is provided as plots showing anomalies’ distribution across the site overlay with the site topographic plan. These are also transposed into AutoCad to provide the Client with accurate DWG or DXF plans showing the locations of buried structures.
Recent Surveys include:
- Mapping buried structures, former refinery, London Gateway, Essex
- Mapping buried structures, former textile mill, Trowbridge
- Geophysical survey to detect buried structures, former munitions factory, Avonmouth
- Mapping foundations, Innovia films factory, Bridgwater
- Survey to Detect Underground Structures at the Site of a Former Tinplate Works, Abercarn
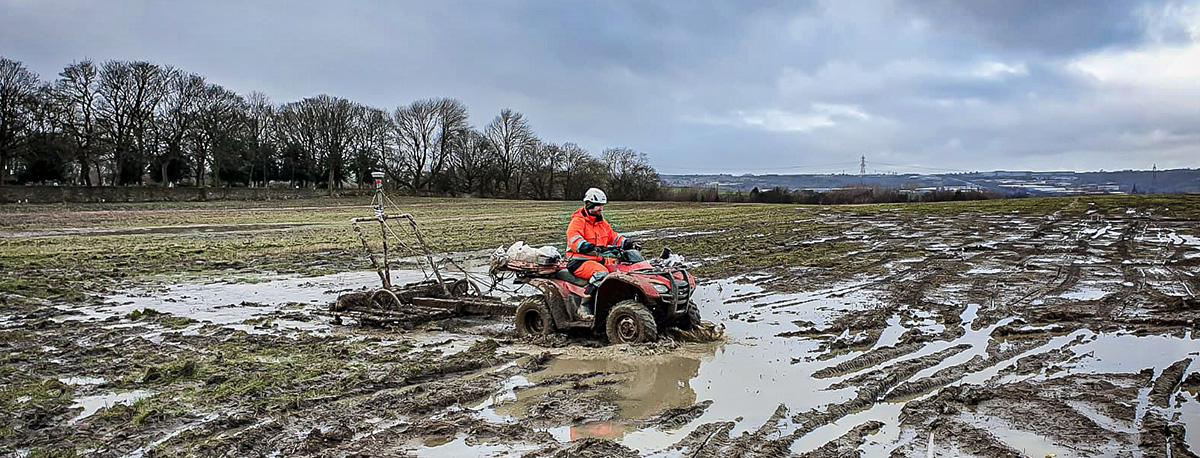
The photo above shows a typical survey setup with the survey instrument mounted on a bespoke cart and towed behind a quad-bike. The resulting data plots are displayed on the right and show, from top to bottom, magnetic data, ground conductivity and a combined interpretive AutoCad DXF showing the locations of the anomalous features. This is presented as part of a written, factual report alongside further interpretive figures.