

The Resistivity technique is useful for characterising the sub-surface materials in terms of their electrical properties. Variations in electrical resistivity (or conductivity) typically correlate with variations in lithology, water saturation, fluid conductivity, porosity and permeability, which may be used to map stratigraphic units, geological structures, sinkholes, fractures and groundwater.
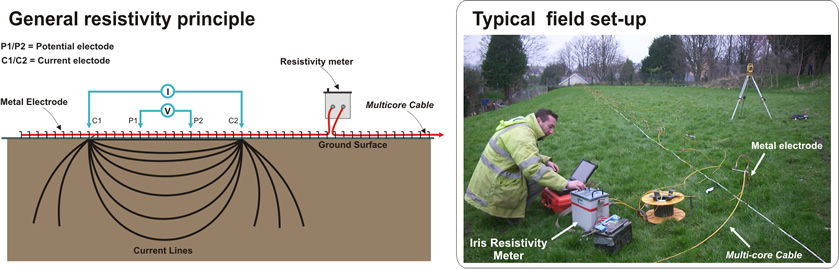
The acquisition of resistivity data involves the injection of current into the ground via a pair of electrodes. Then a corresponding pair of potential electrodes measure the resulting potential field. The field set-up requires deploying an array of regularly spaced electrodes connected to a central control unit via multi-core cables. Resistivity data are then recorded via complex combinations of current and potential electrode pairs to build up a pseudo-cross-section of apparent resistivity beneath the survey line. The depth of investigation depends on the electrode separation and geometry, with greater electrode separations yielding bulk resistivity measurements from greater depths.
The recorded data are transferred to a PC for processing. In order to derive a cross-sectional model of true ground resistivity, the measured data are subject to a finite-difference inversion process via RES2DINV (ver 5.1) software.
Data processing is based on an iterative routine involving the determination of a two-dimensional (2D) simulated model of the subsurface, which is then compared to the observed data and revised. Convergence between theoretical and observed data is achieved by non-linear least squares optimisation. The extent to which the observed and calculated theoretical models agree is an indication of the validity of the true resistivity model (indicated by the final root-mean-squared (RMS) error).
The true resistivity models are presented as colour contour sections revealing spatial variation in subsurface resistivity. The 2D method of presenting resistivity data is limited, where highly irregular or complex geological features are present, and a 3D survey may be required. Geological materials have characteristic resistivity values that enable the identification of boundaries between distinct lithologies on resistivity cross-sections. At some sites, however, there are overlaps between the ranges of possible resistivity values for the targeted materials, which therefore necessitates the use of other geophysical surveys and/or drilling to confirm the nature of identified features.
Constraints: Readings can be affected by poor electrical contact at the surface. An increased electrode array length is required to locate increased depths of interest; therefore, the site layout must permit long arrays. Resolution of target features decreases with increased depth of burial.
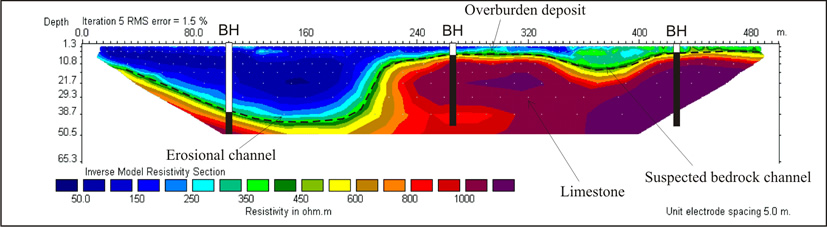
As part of a hydrological study, a series of resistivity tomography profile lines were acquired to map variations within the overburden thickness. The example section above displays an extensive erosional channel feature together with more subtle overburden thickness variations.
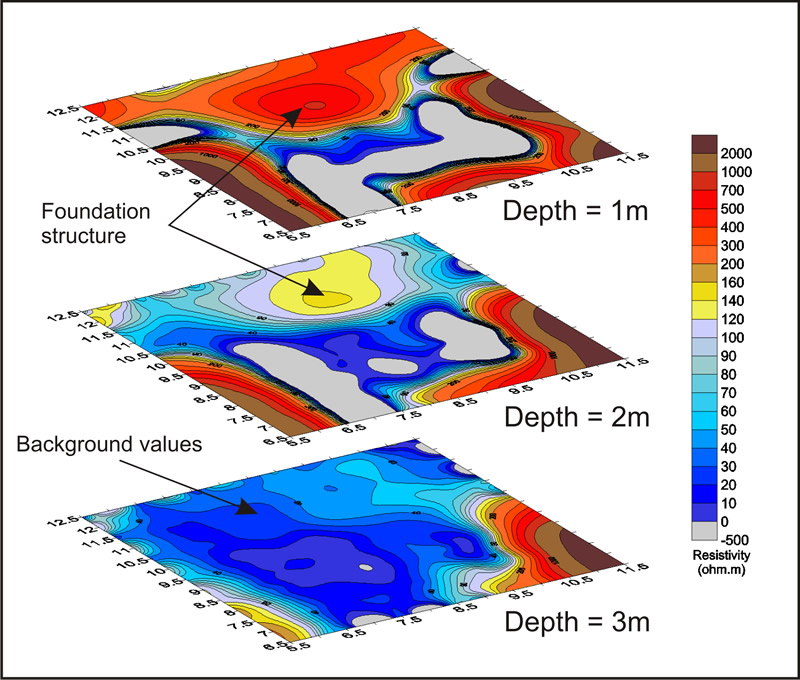
A 3D resistivity survey was carried out to map the lateral and vertical extent of buried foundations. The grey zones represent noisy data due to buried services, and the high resistivity values (red) reflect the foundation material. The resistivity suggests that the foundations extend to a maximum depth of 2m.